Introducing Visual MIDI for pianoroll visualization
2020/09/13
When I was writing Hands-On Music Generation with Magenta during 2019, I knew I would need to generate a lot of MIDI diagrams (often called pianoroll visualization for their similarities to their ancestor, the physical piano roll for automated piano) like this one:
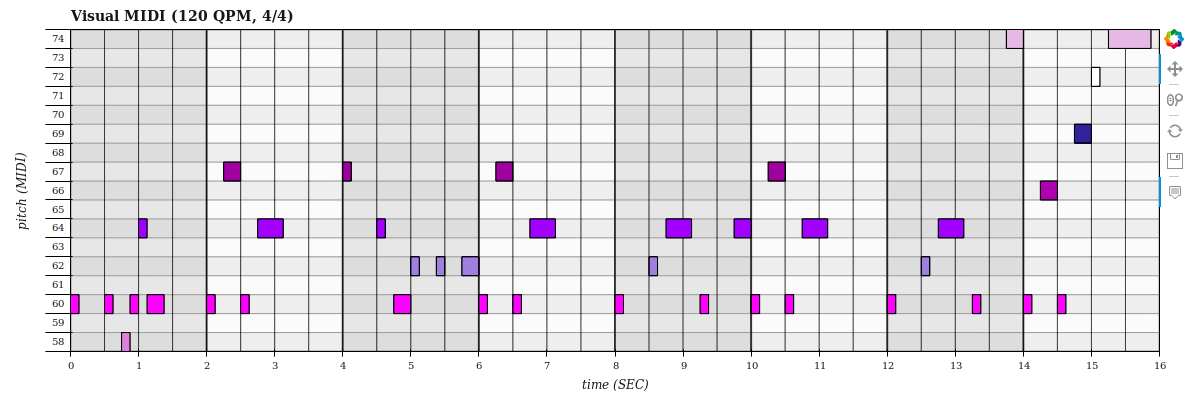
I’ve looked a some existing libraries to do that (such as Pypianoroll or the get_piano_roll function in Pretty MIDI, but I needed more customization on appearance, size, colors, grid, etc. so I decided to write my own library, Visual MIDI.
![]()
Introducing NoteSequence
When using Magenta, we use NoteSequence, an abstraction over a sequence of notes, that is used as an input / output of models for sequential data, such as DrumsRNN, MelodyRnn, MusicVAE, etc. From Magenta 2.1.0 onwards, note sequences are outside of the Magenta package, in their own note-seq library that you can install independently (pip install note-seq). Lets take a look at note sequences (this is taken from the Hello Magenta Jupyter Notebook):
from note_seq.protobuf import music_pb2

twinkle_twinkle = music_pb2.NoteSequence()

# Add the notes to the sequence.
twinkle_twinkle.notes.add(pitch=60, start_time=0.0, end_time=0.5, velocity=80)
twinkle_twinkle.notes.add(pitch=60, start_time=0.5, end_time=1.0, velocity=80)
twinkle_twinkle.notes.add(pitch=67, start_time=1.0, end_time=1.5, velocity=80)
twinkle_twinkle.notes.add(pitch=67, start_time=1.5, end_time=2.0, velocity=80)
twinkle_twinkle.notes.add(pitch=69, start_time=2.0, end_time=2.5, velocity=80)
twinkle_twinkle.notes.add(pitch=69, start_time=2.5, end_time=3.0, velocity=80)
twinkle_twinkle.notes.add(pitch=67, start_time=3.0, end_time=4.0, velocity=80)
twinkle_twinkle.notes.add(pitch=65, start_time=4.0, end_time=4.5, velocity=80)
twinkle_twinkle.notes.add(pitch=65, start_time=4.5, end_time=5.0, velocity=80)
twinkle_twinkle.notes.add(pitch=64, start_time=5.0, end_time=5.5, velocity=80)
twinkle_twinkle.notes.add(pitch=64, start_time=5.5, end_time=6.0, velocity=80)
twinkle_twinkle.notes.add(pitch=62, start_time=6.0, end_time=6.5, velocity=80)
twinkle_twinkle.notes.add(pitch=62, start_time=6.5, end_time=7.0, velocity=80)
twinkle_twinkle.notes.add(pitch=60, start_time=7.0, end_time=8.0, velocity=80)
twinkle_twinkle.total_time = 8

twinkle_twinkle.tempos.add(qpm=60);

# This is a colab utility method that visualizes a NoteSequence.
note_seq.plot_sequence(twinkle_twinkle)
And you can see that the plot_sequence method generates a Bokeh plot:
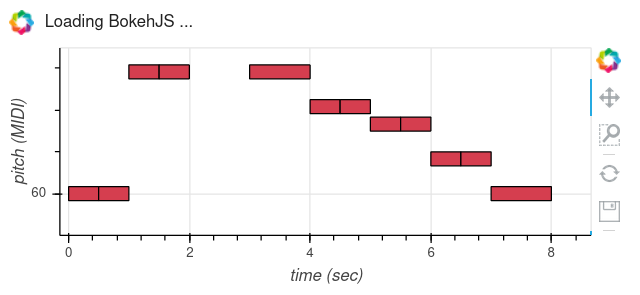
This is included in the “note-seq” library. Visual MIDI is actually based on that rendering, but enables so much more in terms of customizations. But first, lets have a look at Pretty MIDI.
Using Pretty MIDI
When we have a NoteSequence, either from defining it by hand or by getting it from the output of a model, we can transform them back and forth to another format called Pretty MIDI, which is a well-known library used to handle MIDI data in Python.
Let convert from NoteSequence to Pretty MIDI:
from note_seq.midi_io import note_sequence_to_pretty_midi
pm = note_sequence_to_pretty_midi(note_seq)
And from Pretty MIDI to NoteSequence:
from note_seq.midi_io import midi_to_note_sequence
note_seq = midi_to_note_sequence(pm)
We can also load the NoteSequence from a MIDI file (using Pretty MIDI):
from note_seq.midi_io import midi_file_to_note_sequence
note_seq = midi_file_to_note_sequence('my_midi_file.mid')
Using Visual MIDI to plot a pianoroll of Pretty MIDI
Great! Now we can plot our sequence as a piano roll using Visual MIDI:
from pretty_midi import PrettyMIDI

plotter = Plotter()
plotter.show(pm, "/tmp/example-01.html")
Which will open the plot in a new browser window. If you prefer to show the plot in a Jupyter notebook:
from visual_midi import Preset

preset = Preset(plot_width=850)
plotter = Plotter(preset, plot_max_length_bar=4)
pm = PrettyMIDI("docs/example-01.mid")
plotter.show_notebook(pm)
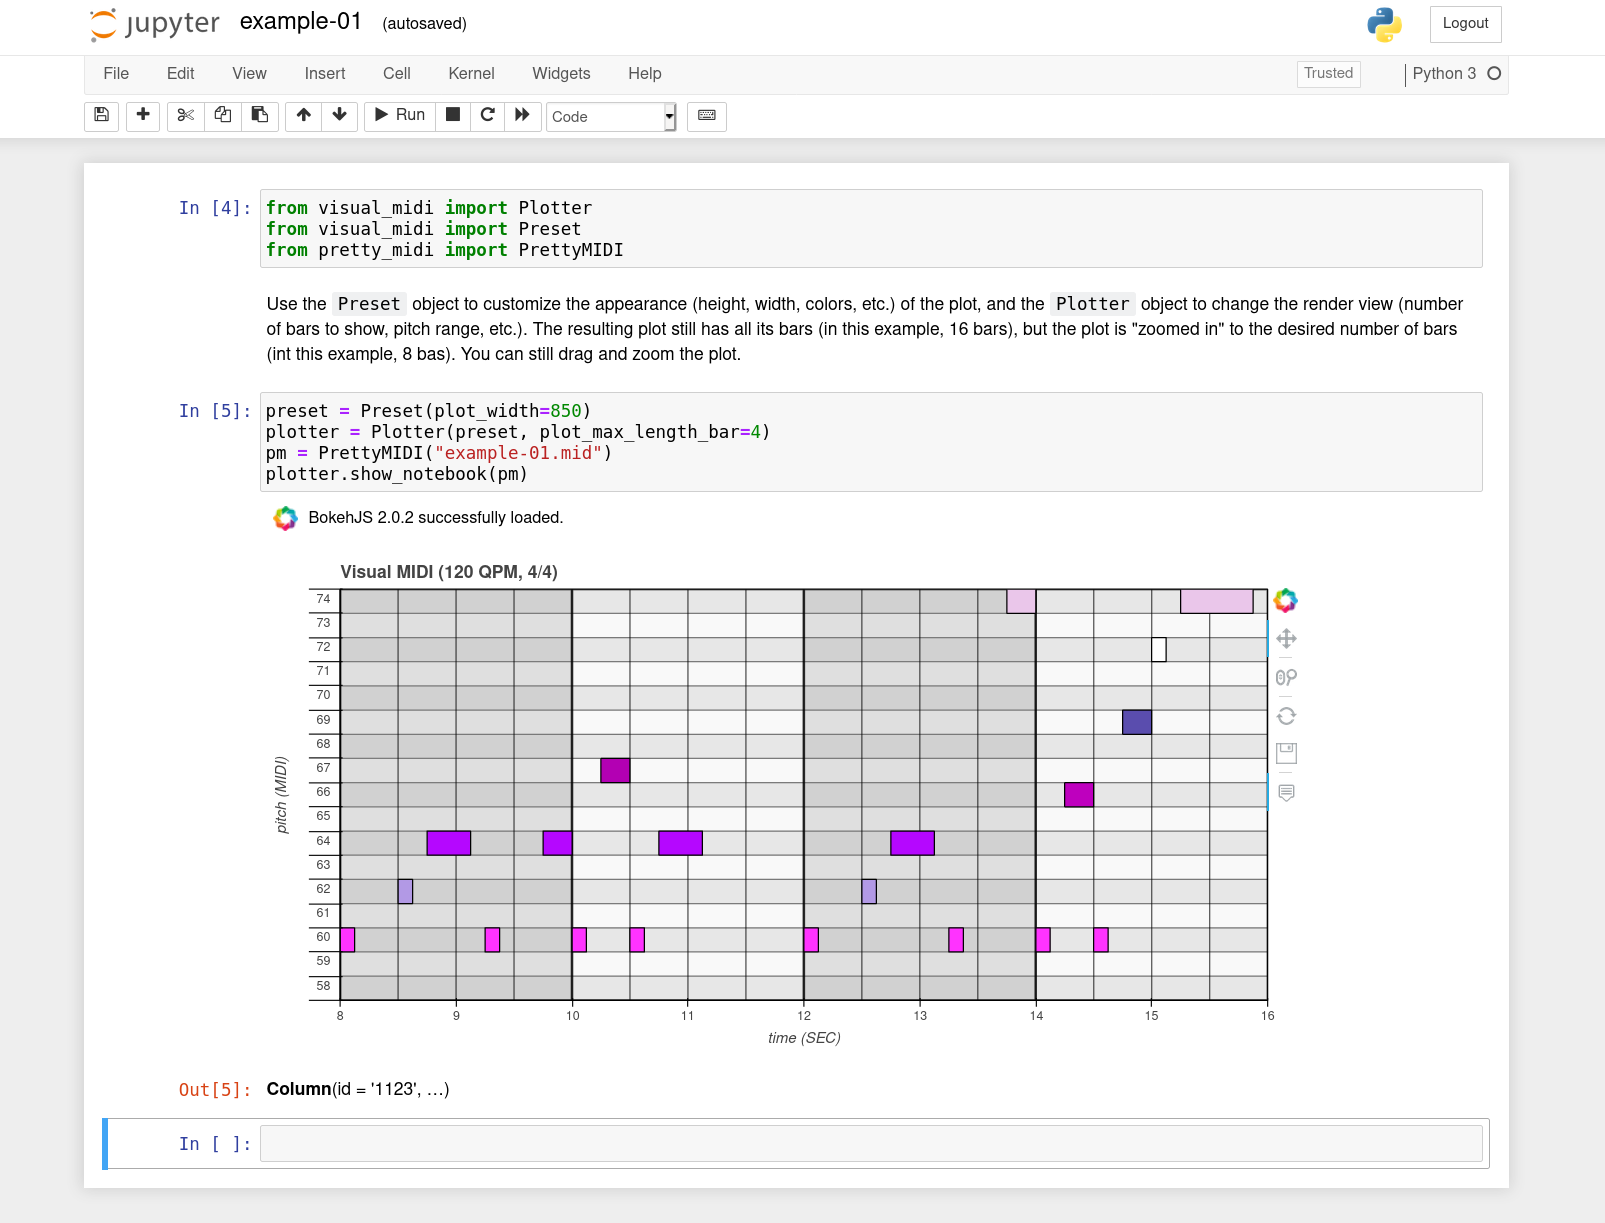
This also introduces the Preset object, which is used to customize the appearance of the plot. Refer to the Visual MIDI documentation for more information.
Further developments
The Visual MIDI library is still in its infancy, if you have comments or requests, please add them to the GitHub Issues page. Happy visualization!